June 26 2011
Visualizing GTD with 1.8K To-Dos in Things
![]()
I was poking around ~/Library/Application Support/ on my Mac and stumbled across the XML database for Cultured Code's Things. Apparently, the first to-do I entered in Things was about Things.
While I've emptied the trash quite a few times since I began using Things in 2008, I still have 1.8K to-dos in the app, mostly in the logbook. I thought it would be interesting to plot them by month, using gRaphael.
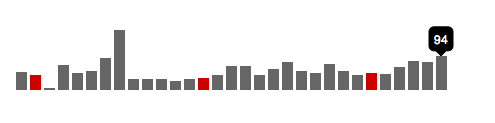
Each month is a bar, and each January is a red bar. While I average around 50 to-dos each month, I added three times that number in July 2009, undoubtedly wedding tasks. Below is the Ruby script I wrote to process Things's XML library and write out an HTML page with embedded gRaphael instructions:
# Require libraries
require 'rubygems'
require 'nokogiri'
require 'open-uri'
require 'time'

# Use Nokogiri and Xpath magic.
doc = Nokogiri::XML(open(File.expand_path("~/Library/Application Support/Cultured Code/Things/Database.xml")))
dates = doc.xpath("//object/attribute[@name='datecreated']").collect {|item| (Time.utc(2001,1,1) + item.content.to_f).strftime("%Y-%m-01") }
# Add up months and separate years (for gray/red bars).
counts_hash = {}
counts_months = []
counts_years = []
dates.each do |date|
  counts_hash[date] = 0 if !counts_hash.include?(date)
  counts_hash[date] += 1
end
counts_hash.keys.sort.each do |date_key|
  date = Time.parse(date_key)
  counts_months << ((date.month == 1) ? 0 : counts_hash[date_key])
  counts_years << ((date.month == 1) ? counts_hash[date_key] : 0)
end

# Write out the HTML and Javascript to make it work.
html = <<EOF
<html><head>
<script type='text/javascript' src='raphael-min.js'></script>
<script type='text/javascript' src='g.raphael-min.js'></script>
<script type='text/javascript' src='g.bar-min.js'></script>
</head><body>
<script type="text/javascript">
window.onload = function () {
// Add hover functions.
var fin = function () { this.flag = r.g.popup(this.bar.x, this.bar.y, this.bar.value || "0").insertBefore(this); };
var fout = function () { this.flag.animate({opacity: 0}, 60, function () {this.remove();}); };
// Graph with gRaphael.
var r = Raphael("thedata");
var chart = r.g.barchart(10, 10, 450, 100, [#{counts_months}, #{counts_years}], {stacked: true});
chart.bars[0].attr({"fill": "#666"});
chart.bars[1].attr({"fill": "#CD0000"});
chart.hover(fin, fout);
}
</script>
<div id="thedata" class="jsgraph"></div>
</body></html>
EOF
f=File.new("things.html","w")
f.write(html)
f.close