June 25 2011
blog.data.visualize()
This blog's sidebar got a little fancier today: sparklines!
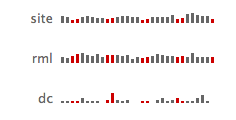
Inspired by infosthetics's google adsense sparklines post, I've added a couple interesting streams of data to the sidebar, both from this website and from my iOS App Store apps. Sparklines are an excellent visualization for conveying a large amount of information in a small space. Here's what I display now:
- site: bdunagan.com blog visits per day (Google Analytics)
- rml: Remind Me Later downloads per day (Appfigures)
- dc: Dollar Clock downloads per day (Appfigures)
I'll walk through how I get the data from those sources into sparklines on my blog.
Getting the Data
First, I needed to get the data from its original location to my blog's server, in a form Javascript could easily find and read. Using Ruby, I extract the data from its service and then write it in JSON to a local file on my web hosting server.
The site data comes from Google Analytics. Getting data from Google is a bit complicated due to its adoption of OAuth. To access Google Analytics information, I wrote a Ruby script leveraging Garb, a great gem from Viget.
# Require libraries.
require 'rubygems'
require 'active_support'
require 'oauth'
require 'garb'
require 'json'

class Time
  def to_js_date
    self.utc.strftime("%Y/%m/%d")
  end
end

# Setup OAuth. (See http://everburning.com/news/google-analytics-oauth-and-ruby-oh-my/.)
# Register a domain: https://www.google.com/accounts/ManageDomains.
oauth_consumer = OAuth::Consumer.new(consumer_key, consumer_secret, {:site => 'https://www.google.com', :request_token_path => '/accounts/OAuthGetRequestToken', :access_token_path => '/accounts/OAuthGetAccessToken', :authorize_path => '/accounts/OAuthAuthorizeToken'})
session = Garb::Session.new
session.access_token = OAuth::AccessToken.new(oauth_consumer, request_token, request_secret)
profile = nil
Garb::Management::Profile.all(session).each |current_profile|
  profile = current_profile if current_profile.title == site_name
end

# Visits/day over last week: bar chart
class RecentVisits
    extend Garb::Model
    metrics :visits
    dimensions :date
end

stop = Time.now
start = stop - 60*60*24*30
start_date = Time.utc(start.year, start.month, start.day - 1)
stop_date = Time.utc(stop.year, stop.month, stop.day - 1)
results = RecentVisits.results(profile, :start_date => start_date, :end_date => stop_date, :sort => :date)
visits = {}
results.each { |result| visits[Time.parse(result.date).to_js_date] = result.visits }
# Save to a file.
f = File.new("ga.txt","w")
f.write(visits.to_json)
f.close
The app data comes from Appfigures. Their API access is based on credentials, but SSL is always required. Below is the Ruby script I wrote to fetch that data.
# Require libraries.
require 'rubygems'
require 'time'
require 'net/http'
require 'net/https'
require 'json'

class Time
  def to_short_date
    self.utc.strftime("%Y-%m-%d")
  end

  def to_js_date
    # Safari Javascript doesn't parse to_short_date format.
    self.utc.strftime("%Y/%m/%d")
  end
end

# Set up environment.
rml_key = 'app_id'
dc_key = 'app_id'
rml_data = {}
dc_data = {}
af_response = nil
day_length = 86400
stop = Time.now
start = stop - 60*60*24*30
start_date = Time.utc(start.year, start.month, start.day - 1)
stop_date = Time.utc(stop.year, stop.month, stop.day - 1)

# Prepopulate dates to ensure range. Appfigures's API is not great about including every day.
current_date = start_date
while current_date <= stop_date
  rml_data[current_date.to_js_date] = 0
  current_date += day_length
end
current_date = start_date
while current_date <= stop_date
  dc_data[current_date.to_js_date] = 0
  current_date += day_length
end

# Fetch data from Appfigures.
http=Net::HTTP.new('api.appfigures.com', 443)
http.use_ssl = true
http.start() {|http|
	req = Net::HTTP::Get.new("/v1/sales/apps+dates/#{start_date.to_short_date}/#{stop_date.to_short_date}/")
	req.basic_auth 'username', 'password'
	response = http.request(req)
	af_response = response.body
}
af_data = JSON.parse(af_response)

# Parse data.
af_data[dc_key].keys.sort.each { |date| dc_data[Time.parse(date).to_js_date] = af_data[dc_key][date]['app_downloads'] }
af_data[rml_key].keys.sort.each { |date| rml_data[Time.parse(date).to_js_date] = af_data[rml_key][date]['app_downloads'] }

# Write to files.
f = File.new('dc.txt','w')
f.write(dc_data.to_json)
f.close
f = File.new('rml.txt','w')
f.write(rml_data.to_json)
f.close
Displaying the Data
Second, I needed to visualize the data. I've been looking for a lightweight graphing library ever since I wrote my post about measuring design changes. For that chart, I used Excel and Acorn. It was slow, painful, and manual. No fun at all.
I asked a friend at LinkedIn for recommendations, and he pointed me to Raphael, an excellent open source tool written in Javascript. I used a higher-level version of the tool called gRaphael.
Infosthetics's sparklines used color to give context to the data: black bars for weekdays this month, dark gray bars for weekends this month, light gray bars for weekdays last month, and a single red bar for today. Small but data-rich. I tried to bring a little of that context to my sidebar's sparklines by coloring the weekends in red but the weekdays in gray. Below is the Javascript code that reads the generated text files and creates the graphs:
<script type="text/javascript">
window.onload = function () {
// Include the following scripts in the header:
// * raphael-min.js
// * g.raphael-min.js
// * g.bar-min.js

// Add hover functions.
var fin = function () { this.flag = r.g.popup(this.bar.x, this.bar.y, this.bar.value || "0").insertBefore(this); };
var fout = function () { this.flag.animate({opacity: 0}, 60, function () {this.remove();}); };

// Getting Data: fetch data from local files and separate into weekdays and weekends to allow grey/red bars in sparklines.

// Get cached GA data.
var ga_xhr = new XMLHttpRequest();
ga_xhr.open('GET', '/files/ga.txt', false);
ga_xhr.send(null);
var ga_response = ga_xhr.responseText;
var ga_data = JSON.parse(ga_response);
var ga_dates = [];
for (var ga_key in ga_data) { ga_dates.push(ga_key); }
ga_dates = ga_dates.sort();
var ga_weekday_values = [];
var ga_weekend_values = [];
for (var ga_dates_key in ga_dates) {
    var ga_key = ga_dates[ga_dates_key];
    var key_date = new Date(ga_key);
    var key_day = key_date.getDay();
    if (key_day == 0 || key_day == 6) {
        ga_weekday_values.push("");
        ga_weekend_values.push(ga_data[ga_key]);
    }
    else {
        ga_weekday_values.push(ga_data[ga_key]);
        ga_weekend_values.push("");
    }
}

// Get cached RML data.
var rml_xhr = new XMLHttpRequest();
rml_xhr.open('GET', '/files/rml.txt', false);
rml_xhr.send(null);
var rml_response = rml_xhr.responseText;
var rml_data = JSON.parse(rml_response);
var rml_dates = [];
for (var rml_key in rml_data) { rml_dates.push(rml_key); }
rml_dates = rml_dates.sort();
var rml_weekday_values = [];
var rml_weekend_values = [];
for (var rml_dates_key in rml_dates) {
    var rml_key = rml_dates[rml_dates_key];
    var key_date = new Date(rml_key);
    var key_day = key_date.getDay();
    if (key_day == 0 || key_day == 6) {
        rml_weekday_values.push("");
        rml_weekend_values.push(rml_data[rml_key]);
    }
    else {
        rml_weekday_values.push(rml_data[rml_key]);
        rml_weekend_values.push("");
    }
}

// Get cached DC data.
var dc_xhr = new XMLHttpRequest();
dc_xhr.open('GET', '/files/dc.txt', false);
dc_xhr.send(null);
var dc_response = dc_xhr.responseText;
var dc_data = JSON.parse(dc_response);
var dc_dates = [];
for (var dc_key in dc_data) { dc_dates.push(dc_key); }
dc_dates = dc_dates.sort();
var dc_weekday_values = [];
var dc_weekend_values = [];
for (var dc_dates_key in dc_dates) {
    var dc_key = dc_dates[dc_dates_key];
    var key_date = new Date(dc_key);
    var key_day = key_date.getDay();
    if (key_day == 0 || key_day == 6) {
        dc_weekday_values.push("");
        dc_weekend_values.push(dc_data[dc_key]);
    }
    else {
        dc_weekday_values.push(dc_data[dc_key]);
        dc_weekend_values.push("");
    }
}

// Graph GA sparkline with gRaphael.
var r = Raphael("gadata");
var chart = r.g.barchart(10, 10, 160, 50, [ga_weekday_values, ga_weekend_values], {stacked: true});
chart.bars[0].attr({"fill": "#666"});
chart.bars[1].attr({"fill": "#CD0000"});
chart.hover(fin, fout);

// Graph RML sparkline with gRaphael.
var r = Raphael("rmldata");
var chart = r.g.barchart(10, 10, 160, 50, [rml_weekday_values, rml_weekend_values], {stacked: true});
chart.bars[0].attr({"fill": "#666"});
chart.bars[1].attr({"fill": "#CD0000"});
chart.hover(fin, fout);

// Graph DC sparkline with gRaphael.
var r = Raphael("dcdata");
var chart = r.g.barchart(10, 10, 160, 50, [dc_weekday_values, dc_weekend_values], {stacked: true});
chart.bars[0].attr({"fill": "#666"});
chart.bars[1].attr({"fill": "#CD0000"});
chart.hover(fin, fout);
}
</script>
These scripts are also available through my GitHub repository.